

Pre-war homes—those built before 1939—are architectural gems. They are sturdy, charming, and often what people are referring to when they look at the prevalent colorless, linear designs of today and lament “they just don’t make them like they used to.”
In some ways, that’s a good thing. Pre-war homes often contained materials we know to be hazardous today, like asbestos and lead. But their signature characteristics, including hardwood floors, nickel accents, ornate crown molding, and high ceilings, are among the features many people look for in a dream home.
Preserving the history of these properties, many of which you’ll find on the National Register of Historic Places, is labor that often extends beyond the scope of an individual homeowner. Depending on where these homes are located, special permission by local historic commissions may be required before renovations can be done in an effort to preserve their historic architectural integrity.
Stacker compiled a list of counties in Oregon with the most pre-war homes using data from the U.S. Census Bureau. Counties are ranked by the highest percent of homes that were built before 1939 based on 2020 5-year estimates.
You may also like: Best community colleges in Oregon
Mrgadget51 // Wikimedia Commons
#30. Clackamas County
– Homes built before 1939: 7.0%
– Homes built since 2000: 20.5%
– Median year built: 1983
– Total homes: 168,828
Lauram12345 // Wikicommons
#29. Lane County
– Homes built before 1939: 7.0%
– Homes built since 2000: 16.7%
– Median year built: 1976
– Total homes: 163,617
Little Mountain 5 // Wikicommons
#28. Jackson County
– Homes built before 1939: 7.0%
– Homes built since 2000: 22.4%
– Median year built: 1982
– Total homes: 96,318
Bruce Fingerhood from Springfield, Oregon, US // Wikimedia Commons
#27. Polk County
– Homes built before 1939: 7.2%
– Homes built since 2000: 26.6%
– Median year built: 1984
– Total homes: 32,572
English: Gary Halvorson, Oregon State Archives // Wikimedia Commons
#26. Douglas County
– Homes built before 1939: 7.2%
– Homes built since 2000: 17.0%
– Median year built: 1977
– Total homes: 50,649
You may also like: Famous actresses from Oregon
EncMstr // Wikimedia Commons
#25. Lincoln County
– Homes built before 1939: 8.0%
– Homes built since 2000: 17.4%
– Median year built: 1979
– Total homes: 31,751
Edmund Garman // Flickr
#24. Marion County
– Homes built before 1939: 8.2%
– Homes built since 2000: 16.9%
– Median year built: 1978
– Total homes: 127,505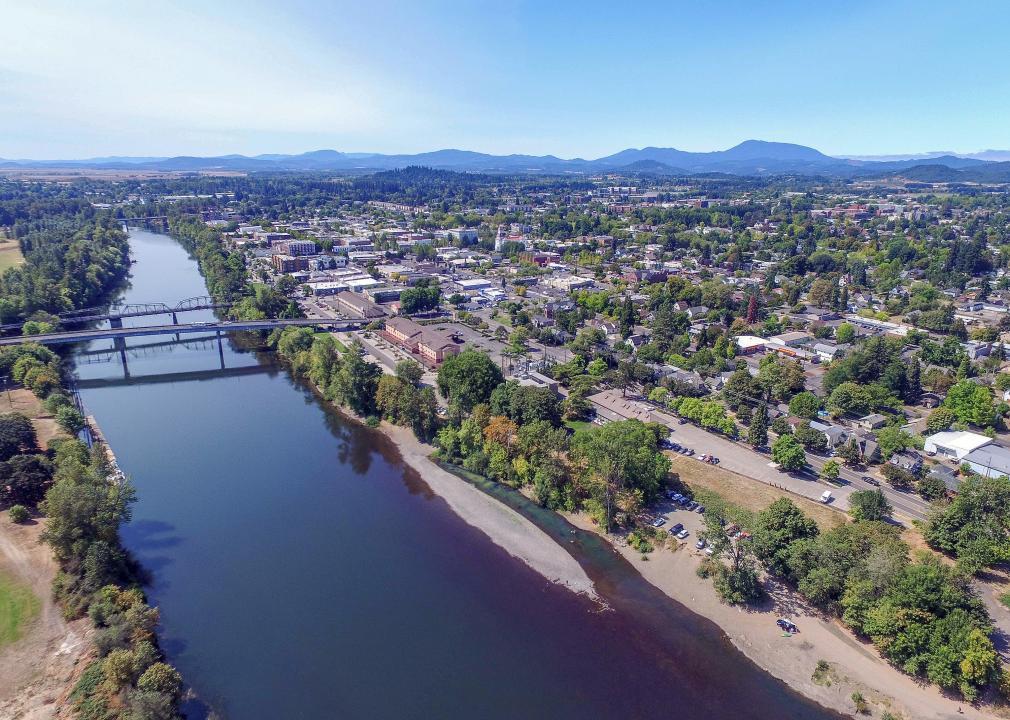
cpaulfell // Shutterstock
#23. Benton County
– Homes built before 1939: 9.0%
– Homes built since 2000: 21.2%
– Median year built: 1978
– Total homes: 38,713
Jmabel // Wikimedia Commons
#22. Linn County
– Homes built before 1939: 9.7%
– Homes built since 2000: 18.9%
– Median year built: 1977
– Total homes: 50,936
Ken Lund // Wikimedia Commons
#21. Lake County
– Homes built before 1939: 10.0%
– Homes built since 2000: 16.8%
– Median year built: 1976
– Total homes: 4,538
You may also like: Zip codes with the most expensive homes in Oregon
Ken Lund from Reno, Nevada, USA // Wikimedia Commons
#20. Malheur County
– Homes built before 1939: 10.1%
– Homes built since 2000: 9.4%
– Median year built: 1974
– Total homes: 11,936
M.O. Stevens // Wikimedia Commons
#19. Yamhill County
– Homes built before 1939: 10.3%
– Homes built since 2000: 23.3%
– Median year built: 1986
– Total homes: 39,504
USFWS Headquarters’ photostream // Wikimedia Commons
#18. Tillamook County
– Homes built before 1939: 12.6%
– Homes built since 2000: 23.3%
– Median year built: 1981
– Total homes: 19,157
Gancayco // Wikimedia Commons
#17. Umatilla County
– Homes built before 1939: 12.7%
– Homes built since 2000: 17.0%
– Median year built: 1976
– Total homes: 30,722
Finetooth // Wikimedia Commons
#16. Morrow County
– Homes built before 1939: 12.9%
– Homes built since 2000: 15.8%
– Median year built: 1979
– Total homes: 4,699
You may also like: Colleges with the best ROI in Oregon
Debbie Tegtmeier // Wikimedia Commons
#15. Coos County
– Homes built before 1939: 13.2%
– Homes built since 2000: 12.6%
– Median year built: 1972
– Total homes: 31,246
Bobjgalindo // Wikimedia Commons
#14. Klamath County
– Homes built before 1939: 14.1%
– Homes built since 2000: 15.1%
– Median year built: 1976
– Total homes: 33,703
Finetooth // Wikimedia Commons
#13. Grant County
– Homes built before 1939: 15.4%
– Homes built since 2000: 13.3%
– Median year built: 1973
– Total homes: 4,426
Cacophony // Wikimedia Commons
#12. Columbia County
– Homes built before 1939: 17.8%
– Homes built since 2000: 18.1%
– Median year built: 1978
– Total homes: 21,421
Cacophony // Wikimedia Commons
#11. Wasco County
– Homes built before 1939: 17.8%
– Homes built since 2000: 13.4%
– Median year built: 1972
– Total homes: 11,712
You may also like: Most popular girl names in the 80s in Oregon
Sam Beebe // Wikimedia Commons
#10. Hood River County
– Homes built before 1939: 18.7%
– Homes built since 2000: 24.0%
– Median year built: 1978
– Total homes: 10,034
Ken Lund // Wikimedia Commons
#9. Harney County
– Homes built before 1939: 19.1%
– Homes built since 2000: 13.5%
– Median year built: 1973
– Total homes: 3,897
Sam Beebe // Wikimedia Commons
#8. Wallowa County
– Homes built before 1939: 20.6%
– Homes built since 2000: 17.3%
– Median year built: 1973
– Total homes: 4,234
Tomas Nevesely // Shutterstock
#7. Wheeler County
– Homes built before 1939: 22.2%
– Homes built since 2000: 15.4%
– Median year built: 1978
– Total homes: 991
English: Gary Halvorson, Oregon State Archives // Wikimedia Commons
#6. Clatsop County
– Homes built before 1939: 23.0%
– Homes built since 2000: 15.6%
– Median year built: 1974
– Total homes: 22,609
You may also like: Biggest sources of immigrants to Oregon
Stuart Seeger // Wikicommons
#5. Multnomah County
– Homes built before 1939: 24.1%
– Homes built since 2000: 17.1%
– Median year built: 1969
– Total homes: 353,735
Williamborg // Wikimedia Commons
#4. Union County
– Homes built before 1939: 25.1%
– Homes built since 2000: 13.1%
– Median year built: 1973
– Total homes: 11,863
Tedder // Wikimedia Commons
#3. Gilliam County
– Homes built before 1939: 26.8%
– Homes built since 2000: 12.3%
– Median year built: 1958
– Total homes: 1,145
Finetooth // Wikimedia Commons
#2. Baker County
– Homes built before 1939: 29.3%
– Homes built since 2000: 11.8%
– Median year built: 1970
– Total homes: 9,062
Finetooth // Wikimedia Commons
#1. Sherman County
– Homes built before 1939: 37.5%
– Homes built since 2000: 6.6%
– Median year built: 1958
– Total homes: 905
You may also like: Most popular boy names in the 60s in Oregon